First, I'll talk about the implementation. I had 7 different grow beasts: 2 frogs, 2 lizards, 2 skeletons and 1 shark. Each table was assigned one of the grow beasts. On day 1, we defined what measurements we would be taking each day. I had a simple chart that defined measurement 1, 2, 3, 4 and 5 for each grow beast. Students took initial measurements of their beasts. I had students submit their measurements through a very simple Google form. I also made initial measurements of each of the different types of grow beasts. We also examined the claims on the package (I hung them on the wall as reference), which included the following claims:
The next day, we organized all of the data and looked for outliers. For each measurement that didn't make sense, we decided what to do about it. In a few cases, we threw the data out that clearly seemed incorrect. In a few cases, the decision of the class was that the measurement had accidentally been taken in centimeters instead of millimeters, in which case we fixed it. We also made predictions of what we thought would happen. This was a great chance for me to begin to understand my students thinking before we started our unit. I tried to focus our discussion on key issues relating to similarity, such as whether all parts of the body would grow equally, and whether the angles in the figures (such as the angles of the legs in the frog) would stay the same or change as the beast grew. Student response was mixed on these issues, so the discussion was very eye-opening for me. It gave me a good window into my students' initial thinking about similarity. I also had students make predictions about what would be the size of each of the measurements if they all doubled, or if they all tripled. At the end of the day, I put the grow beasts in water.
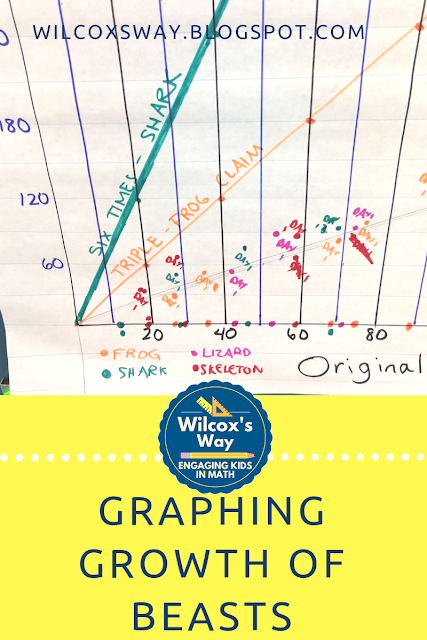
I also made a graph with all of the initial measurements, as well as a line showing the measurements for growing 3 x bigger and growing 6 x bigger. I had original measurements as my x variable and growing measurements as my y variable. I started by putting all of the original measurements on the x-axis. I made it on a big sheet of chart paper. This graph became a central place for me record all of the results and became the guide for many of our discussions. I was so glad to have this graph to refer to throughout our grow beast project. I also really liked that it was a great way to introduce the concept of proportionality, although we didn't formally use that language. For someone teaching 8th grade or Algebra, this might also be an interesting way to look at trend lines. I definitely found that each day's data made a somewhat linear pattern on the graph, although measurement accuracy (or lack of) might be a problem. You could also use Desmos to graph your data.
Our warm-up each day was to measure the grow beasts. I usually gave them the first 5 minutes of class to get their measurements submitted. If you're going to do this, you'll want to make sure that you have a towel around to dry off the beasts before you measure them. The kids got really excited to see how they grew. Each day I would put up the chart that listed the different measurements, and the kids continued to complete the same Google Form over and over with the measurements for the grow beast. This project definitely reminded me that having students measure is so important, and they REALLY need the practice! I also liked having students give the data via the Google Form. It allowed me to easily sort the data by the animal type, and then by date so we could really see the trends in growth.
At the end of each day, I also measured the grow beasts and add the new data to the class graph. I had each figure color coded on the graph, but it was really cool to see how you could see a trendline of growth for all of the figures. I loved the fact that I had already put the tripling line and 6 x bigger line on the graph, so when I showed it to the kids we could compare it to those benchmarks.
One interesting (and fortunate) thing that happened to me was that one of my frog grow beasts did not grow for some reason. That group of students was kind of bummed out, but as a teacher it was terrific! We had initially debated whether the angles of the legs would stay the same, and this way we actually were able to check it out. If you plan to do this project, if possible, you might get one grow beast that doesn't go in the water to compare back to.
We let our grow beasts grow until they stopped. For us, that was about 7 days. They were close to triple in size, but none of them quite made it. This did make a great impression on my class. It also sparked a fantastic discussion about mathematical similarity. By the time we finished the project, I had introduced 2-D similarity (Wumps, for you all CMP users!) and we had a great discussion of what the grow beasts had to do with Wumps and everything that we had learned about the characteristics of similar figures.
If you're interested in joining my mailing list for more tips and freebies, click here!


No comments:
Post a Comment