1. Linear regression
I can't even begin to tell you how much easier it is to use Desmos than a regular graphing calculator. I teach one section of Integrated Math 1, and I always used to completely DREAD the lessons on linear regression. You know, like, give me a stomachache and make me not want to get out of bed that morning kind of dread. I would spend forever the day before making sure that every graphing calculator was working and had all the right settings....and it never mattered. I would still spend the entire hour running around, fixing settings and putting aside the calculators that I couldn't figure out what was wrong.
But not with Desmos. With Desmos it's soooooo easy! No settings to worry about, much easier to enter data. It's just EASY! Plus, they have a super easy tutorial. You just need to click on the question mark in the upper right-hand corner, and the tour to show you how to do regression is right there.
2. Create tables and graphs I can screenshot to use in other things
When I'm making a test or activity for class, I often find myself using Desmos and taking a screenshot. Easy peasy!
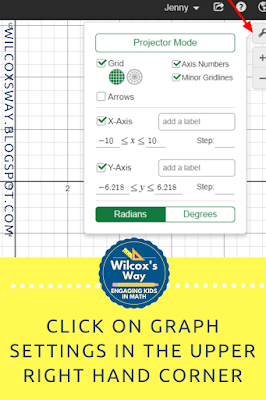
3. Label axes and zoom in and out on your graph
This is kind of a subpoint from above, but I have recently discovered that you can label the axes on your Desmos graph. Plus you can easily zoom in or out depending on the view you want to see of your graph. Makes it even better!
4. Export and share your graphs
This is also useful in addition to taking a screenshot. I find that the lines are a little bit darker than a screenshot, so sometimes I prefer this method.
In addition, you can also share a graph this way. For example, if you had created a graph that you already set up some of the labels or axes for your students, you could share it with them.
5. You can add photos to the background of your graph.
This is a great way to incorporate real-life situations and help students connect them to the real world.
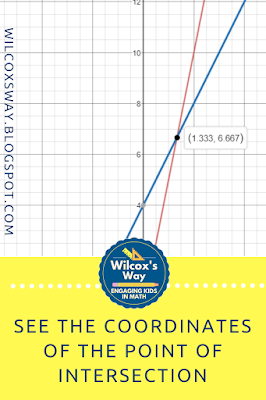
6. Students can easily graph systems of equations and see the point of intersection with accuracy to the nearest tenth.
Last year, I was teaching a lesson from one of my favorite units, Moving Straight Ahead. This is a unit about linear relationships, and we were working on the Henri and Emile problem. This is a problem about two brothers who are racing. They have different speeds, and the older brother gives the younger brother a head start. Students are supposed to decide how long the race will be so that the younger brother wins a close race.
Most of my students solve this using a table or guess and check. I was so excited to watch one group of students decide to use Desmos to solve the problem. They graphed the equation of each brother and could clearly see the point of intersection (where the brothers are tied). I thought it was absolutely amazing that students saw the technology of Desmos as a tool to help solve the problem, and understood how to use it and how to interpret the answer. The rest of the class was so impressed with this solution....and wished they had thought to use it!
7. Add sliders to let students play around with concepts of slope and y-intercept.
This is such an easy way for students to play around with what happens to your line as you change elements of the equation, without having to graph everything by hand. It helps students to see the big picture and analyze patterns.
If you haven't yet, it's time to give Desmos a try! Leave a comment telling me your favorite feature of Desmos!


No comments:
Post a Comment