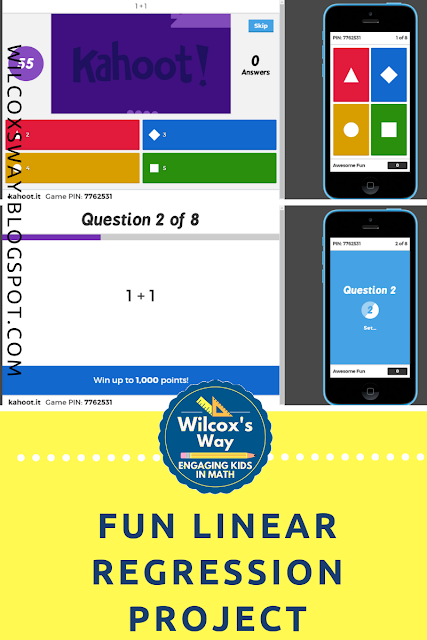
As our discussions of Kahoot scoring began, it was clear to everyone that the two variables that impact your score are time to answer and answer streaks. Trying to figure out how both of these variables affected your score was the foundation of our project.
The first thing we had to do was find a way to collect data about these variables. My teacher's brain went into overdrive trying to figure out exactly how we could collect the data so that my students would have data to analyze. However, rather than just organizing the data collection myself, we started the project by having a class discussion about how to collect meaningful data relating how time impacts your score in Kahoot. I felt like having students think through the process of how to collect meaningful, useful data was very important. I was so excited that the plan the kids came up with was basically the same thing I had planned to do.
Here was the plan: Each student would be assigned a specific time at which they were supposed to answer. Students would answer at the specified time and record how many points they received on that particular question (rather than their overall score). The class decided that after each correct answer, you had to miss the next question so that no one had an answer streak that would impact their score. We played through the Kahoot a few times with different time limits on the questions. Throughout the data collection process, we used the same Kahoot. It was a 10 question Kahoot in which every question was 1 + 1, and the right answer was always in the same place.
Next, we collected data about answer streaks. This time, the entire class answered at the same time but each student had a different amount of questions they were supposed to get correct. Once I had collected all of the time and answer streak data, I transferred it over to Google Sheets so that I could easily share it with students. Now we were ready to get to work on our linear regression project.
The project had several parts for students to complete:
- Data table and graph with at least 8 points relating time and score
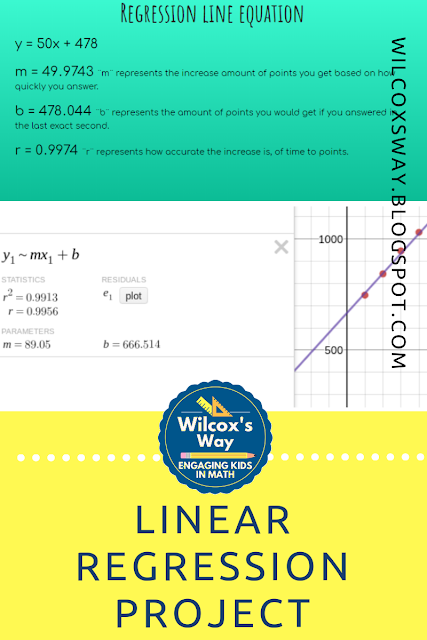
- Linear regression equation relating time and score. Students had to explain the m and b value within the context of a Kahoot game, as well as explain what the r value meant
- Data table and graph with at least 6 points relating answer streak and score
- Linear regression equation relating streak and score. Students again had to explain the m and b values within the context of a Kahoot game and explain the r value. In addition, students had to explain any limits to the domain (because the streak bonus eventually maxes out)
- A predicted score on a fake Kahoot game compared to the actual score--This was my favorite part of the project. Students had to use their equations to predict their score on an 8 question Kahoot. They had to specify when they would answer and if they would get it right or wrong. Then we actually played the Kahoot so they could see how well the equations worked. It was a lot of fun to hear, "My prediction was only 5 points off!" and the rest of their excitement!
- A letter explaining what the student liked about the Kahoot scoring algorithm or a suggestion to change it for the better
Overall, I really liked this project much better than using fake linear regression data from our textbook. If I had to do it over again, I would probably only focus the project on the time aspect and not worry about answer streaks. Having two sets of data definitely complicated things. Overall, this was a fun project for my linear equations unit.
If you'd like a copy of this project, click here to join my email list and you'll get access to this project.


